Screen Resolution
?Higher resolution (1440p, 4K) puts more load on the GPU, reducing CPU bottlenecks. At 1080p the CPU is more often the limit.
Primary Use
?Different workloads stress CPU and GPU differently. Gaming weights GPU heavily; Video Editing weights CPU and RAM; Workstation/3D weights GPU VRAM and CPU cores.
▼
Advanced Options — RAM & Storage
optional
Storage Type
?Storage affects texture streaming and load times. HDD creates stutter when VRAM is full. NVMe Gen4/5 nearly eliminates storage as a bottleneck.
CheckBottleneck.com — PC Bottleneck Analysis Report
Generated:
📊
CPU / GPU Bottleneck Analysis
0%
cpu / gpu bottleneck
CPU Score
—
—
VS
GPU Score (adj.)
—
—
—
Bottleneck
—
Resolution
—
Rating
—
Workload
Results:
🖥️
Full System Score
—
Overall
out of 100
—
Performance
workload match
—
Balance
harmony
Component impact for —
💾
RAM & Storage Analysis
💡
Upgrade Recommendations
📧 Get Your Results by Email
We'll send your full bottleneck report straight to your inbox.
📧 Email Your Results
Enter your email and we'll send your full bottleneck analysis report.
🔌 Embed This Calculator
Copy the code below to embed the CheckBottleneck calculator on your website or blog.
Loading...
Free to use with attribution link. Powered by CheckBottleneck.com
Simple Process
How the Bottleneck Calculator Works
Three steps to find out if your PC components are holding each other back.
1
Select Your Hardware
Choose your CPU and GPU from our database of 150+ components — including all 2026 hardware from Intel, AMD, and NVIDIA.
2
Set Your Workload
Pick your resolution, primary use (gaming, editing, streaming), RAM capacity, and storage type for a complete system analysis.
3
Get Instant Results
Receive a bottleneck percentage, full system score, and actionable upgrade recommendations specific to your hardware combination.
Why CheckBottleneck?
The Most Accurate Free Bottleneck Tool
We go further than other calculators — covering the full system, not just CPU and GPU.
🎯
Workload-Aware Scoring
Unlike basic calculators, our tool weights components differently depending on whether you're gaming, streaming, video editing, or running a 3D rendering workstation. You get results relevant to how you actually use your PC.
💾
Full System Analysis
We don't just check CPU vs GPU. Our advanced mode analyzes your RAM capacity, RAM speed, and storage type (HDD/SSD/NVMe) — because bottlenecks can hide anywhere in your system, not just in your processor or graphics card.
🔄
Always Up to Date
Our hardware database is updated with every major GPU and CPU release. RTX 5000 Blackwell, RX 9000 RDNA 4, Intel Arc Battlemage, AMD Ryzen 9000, and Intel 14th Gen are all included with calibrated benchmark scores.
📊
Calibrated Benchmarks
Our performance scores are calibrated against real-world data from Cinebench R24, PassMark 11, and 3DMark TimeSpy — not manufacturer marketing figures. This means our bottleneck percentages closely match what you'll actually experience.
🚀
Instant Results
No waiting, no sign-up, no downloads. Our calculator runs entirely in your browser and delivers results in under a second. It works on any device — desktop, tablet, or mobile.
💡
Smart Recommendations
Every result comes with tailored upgrade recommendations. We tell you specifically what to upgrade and why — based on your exact hardware combination, budget tier, and usage scenario.
Popular Combinations
Popular CPU & GPU Pair Analysis
Get a detailed bottleneck report for the most searched hardware combinations — with 1080p, 1440p, and 4K analysis.
Everything you need to know about PC bottlenecks and how our calculator works.
A CPU bottleneck in gaming happens when your processor cannot deliver frames fast enough for your GPU to render. The GPU finishes its work and sits idle waiting for the CPU to feed it data. This results in lower FPS, inconsistent frame pacing, and stuttering — especially noticeable in open-world games and titles with lots of AI or physics calculations.
No, a 10% bottleneck is completely normal and acceptable. In real-world testing, even perfectly matched systems show 5–10% variance depending on the game engine. You will not notice any performance difference from a 10% bottleneck. Only bottlenecks above 20–25% become noticeable, and above 40% are considered severe.
A bottleneck of 0–10% is ideal and imperceptible. 10–25% is mild and acceptable for most gamers. Above 25% starts to show real performance loss. Above 40% is severe and indicates a significant hardware mismatch that should be addressed with a hardware upgrade.
Yes, RAM affects bottlenecking in two ways. First, insufficient RAM capacity forces Windows to use the page file (virtual memory on your storage drive), dramatically reducing performance. Second, slow RAM speed — especially on AMD Ryzen platforms — acts as a hidden bottleneck by limiting the CPU-to-memory bandwidth. Running DDR4-3600 or DDR5-6000 in dual-channel mode can improve gaming performance by up to 20%.
The easiest method is to use MSI Afterburner with RivaTuner overlay while gaming. If your GPU usage is consistently below 95% and your CPU usage is at or near 100%, you have a CPU bottleneck. You can also check our free bottleneck calculator above for an instant result based on your specific CPU and GPU combination.
PC bottlenecks are caused by a performance mismatch between components. The most common causes are: pairing a budget CPU with a high-end GPU, running at a low resolution (1080p) which puts more work on the CPU, running games with many AI units or physics simulations, insufficient RAM in single-channel mode, and using slow HDD storage that limits texture streaming.
It depends on your bottleneck type. Run our bottleneck calculator to find out. If you have a CPU bottleneck (common at 1080p, in strategy games, or while streaming), upgrade the CPU first. If you have a GPU bottleneck (common at 1440p/4K or in graphically demanding games), upgrade the GPU first. For most PC gamers, the GPU upgrade delivers the bigger FPS improvement.
Yes, significantly. Higher resolutions (1440p, 4K) put much more load on the GPU, making CPU bottlenecks rare and GPU bottlenecks common. At 1080p, the GPU renders frames quickly and spends more time waiting for the CPU, making CPU bottlenecks more prevalent. Increasing your resolution is often a free way to reduce a CPU bottleneck.
Our bottleneck calculator uses benchmark composite scores calibrated against Cinebench R24, PassMark 11, and 3DMark TimeSpy data. It reliably identifies bottleneck direction and severity. However, real-world performance also depends on the specific game engine, driver version, RAM configuration, background processes, and system cooling. Use results as a guide — they are typically within 5–10% of real-world measurements.
Common CPU bottleneck symptoms include: GPU usage consistently below 90–95% in games, frame rate drops specifically when many characters or AI units are on screen, inconsistent frame pacing (stutters) even when average FPS looks acceptable, worse performance in CPU-intensive games like strategy titles or open-world games, and performance that does not improve when lowering GPU-heavy settings like shadow quality or resolution.
From The Blog
Latest PC Performance Guides
Expert guides on bottlenecks, upgrades, and getting the most from your hardware.
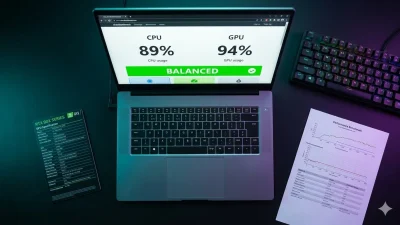
The laptop bottleneck calculator works differently from a desktop tool — because laptop bottlenecks work differently from desktop bottlenecks. In a desktop PC, your CPU and GPU operate…
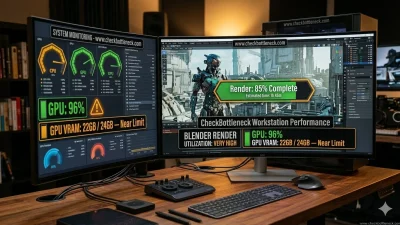
The 3D rendering bottleneck you experience depends almost entirely on which rendering engine you use — and most articles about rendering performance never make this distinction clearly. A…
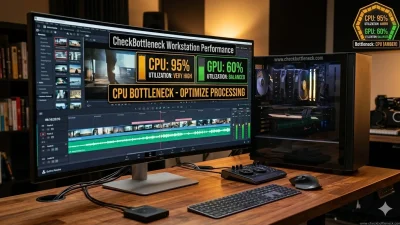
A video editing bottleneck looks completely different from a gaming bottleneck — and most PC guides treat them the same, which leads to expensive wrong upgrades. Video editing…